By Tim Parle
Internet access in South Africa
The South Africa Institute of Race Relations (IRR) recently launched a new comfort and deprivation index that can be used to track and compare the relative standards of living within local authorities in South Africa. The index will allow commentators, journalists, politicians, and ordinary citizens to compare the relative performance of all district and metropolitan municipalities in South Africa.[1].
- The comfort index was drawn up according to five indicators: attainment of higher education; ownership of a refrigerator; use of electricity for heating; having a flush/chemical toilet and individual monthly income of R25‚601 or more[2].
- The deprivation index was compiled using the following indicators: people with no schooling; the unemployment rate; lack of access to piped water; lack of access to a toilet and a monthly income of R1‚600 or less.
The IRR index covers 8 metropolitan municipalities and 44 district councils. The results published in June 2016 showed that the Alfred Nzo district municipality‚ incorporating Mount Ayliff and home to 800‚000 people‚ is the worst off in the country. The other district municipalities identified in the study as having a particularly high level of deprivation were the OR Tambo district (also Eastern Cape) and three district municipalities in KwaZulu-Natal: uMkhanyakude, uMzinyathi and Zululand.
What about internet access?
In response to the above, BMI-T has compiled an Internet Services Deprivation Index (ISDI) based on recent data from StatsSA’s Community Survey 2016. Their study looked at the methods of internet access for the 16.92 million households across South Africa. The survey considered the following methods of accessing the internet:
- Internet connection in the dwelling
- Internet connection from a library/community hall/Thusong centre
- Internet for students at a school/university/college
- Internet connection at a place of work
- Internet cafe 2 km or less from the dwelling
- Internet cafe more than 2 km from the dwelling
- Any place via a cellphone
- Any place via other mobile access service
- Other
Appropriate responses were ‘yes’, ‘no’ or ‘unspecified’.
To prepare the ISDI, BMI-T considered the level of service penetration in each of the 234 municipalities and ranked these. The level of ‘no’ response was considered plus half the ‘unspecified’ level as this was statistically significant at an average of around 10% of the responses. The scores were then ranked and summed to provide the overall index – the higher the score, the poorer the composite level of internet access.
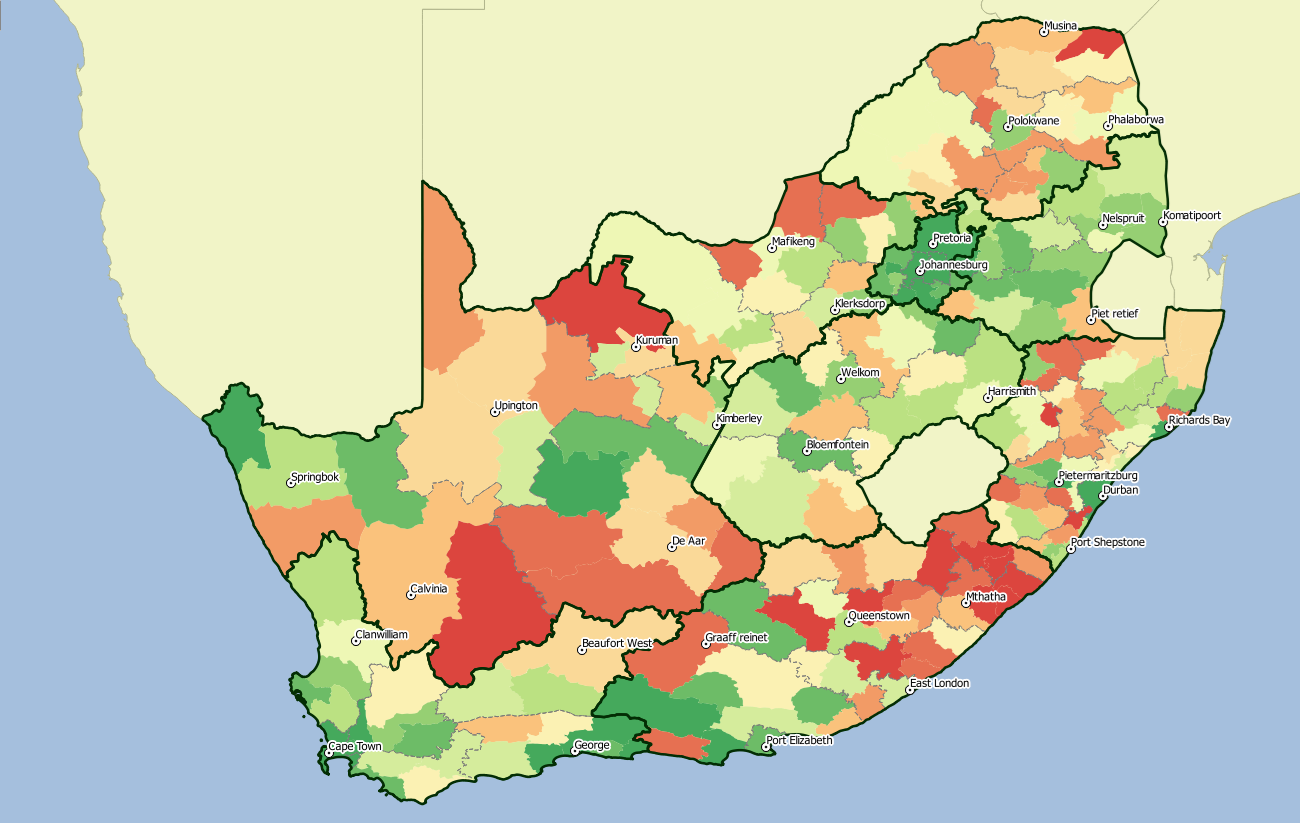
Figure 1 shows a graphical view of the ISDI: dark red areas have the highest levels of deprivation while those in dark green have the least. The immediate observation is that the worst off areas include the northern half of the Eastern Cape, the southern parts of the Northern Cape, southern KwaZulu-Natal and most of Limpopo.
Figure 1 - BMI-T ISDI 2016
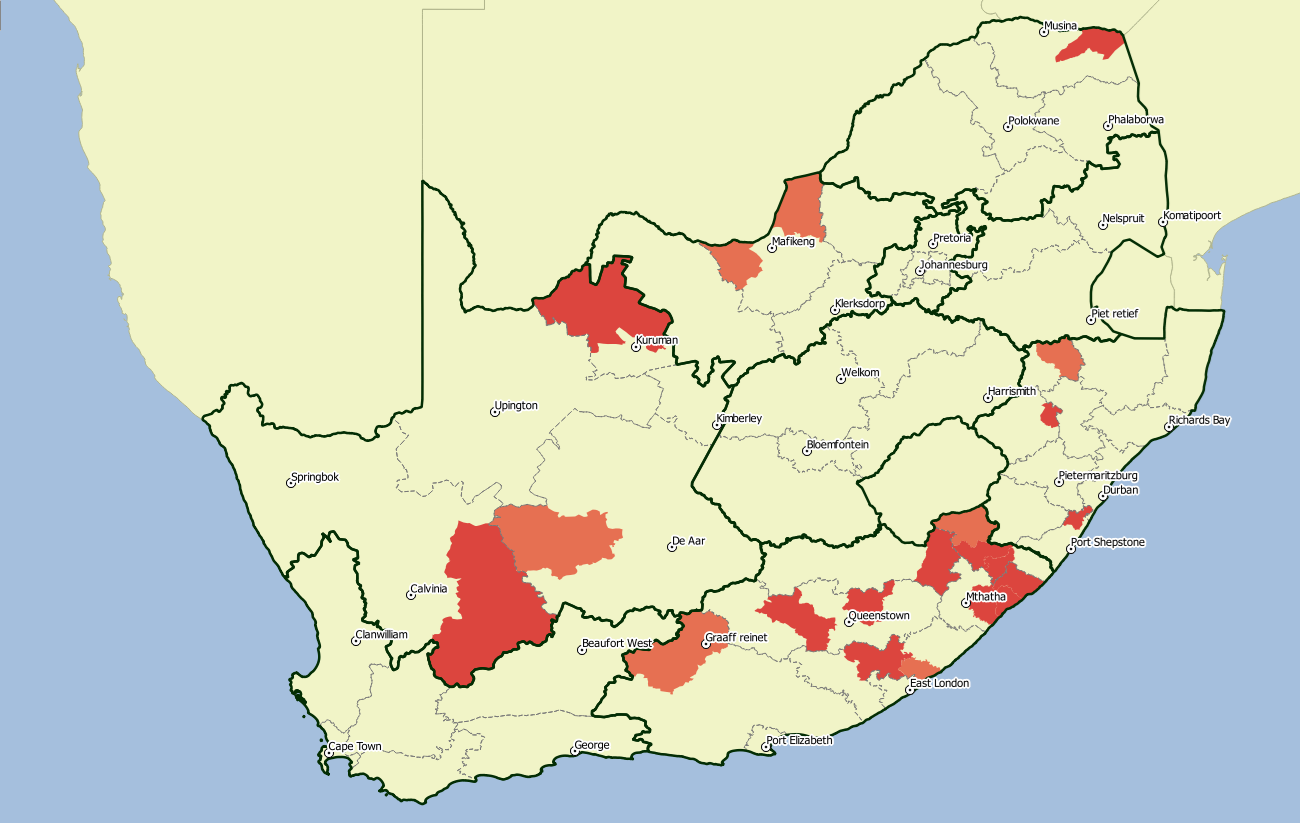
The lowest ranking municipalities are shown in Figure 2 below
Figure 2 - 20 municipalities with the highest (worst) rankings on the BMI-T ISDI 2016
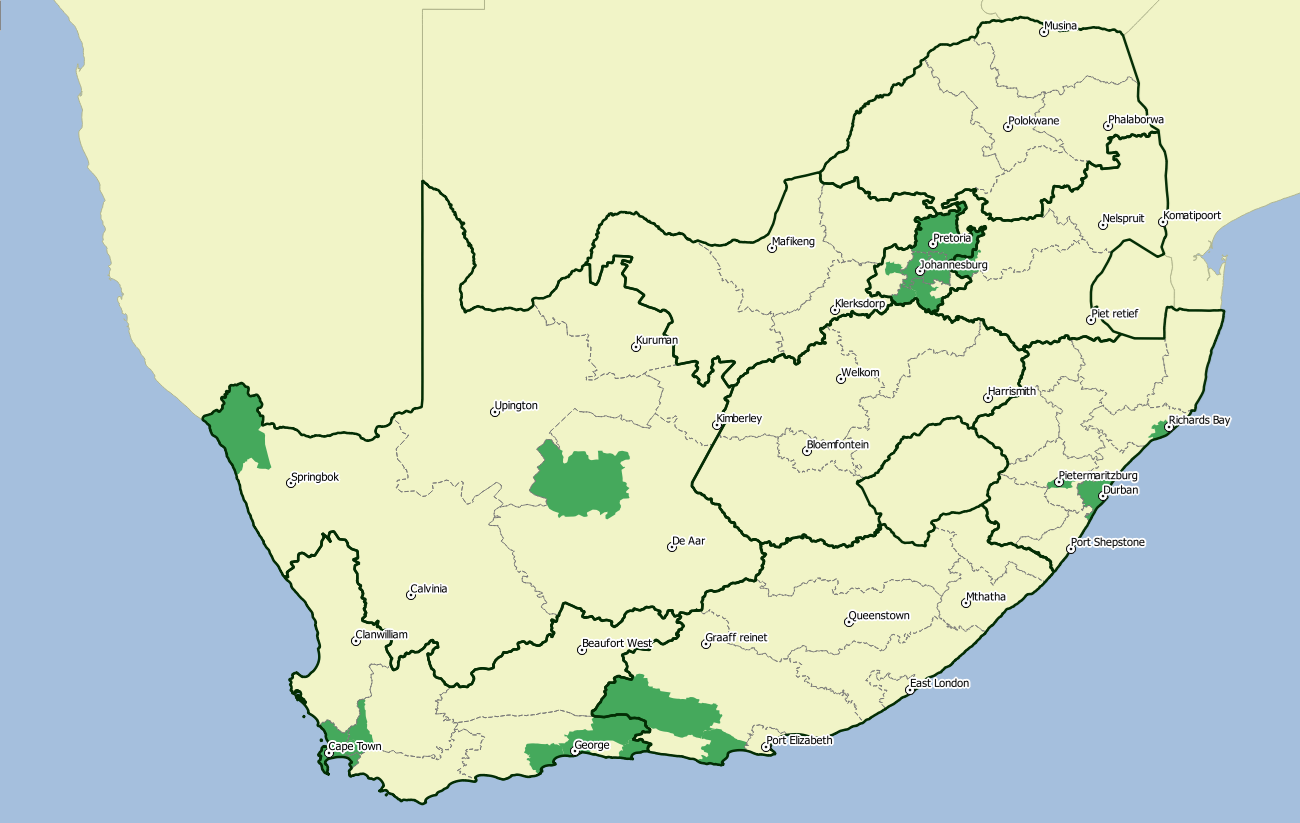
In Figure 3 the 8 priority areas identified for the National Health Insurance (NHI) pilot scheme are shown. These also the areas identified in SITA's Broadband Connectivity tender. The choice of these was based on the South African Multidimensional Poverty Index (SAMPI), which was based on Census 2011 data. From the observation, there is a reasonable correlation between these areas and those with the highest IDSI scores.
Figure 3 - 20 municipalities with the highest (worst) deprivation ranking on the BMI-T ISDI 2016 plus SITA & NHI priority areas.
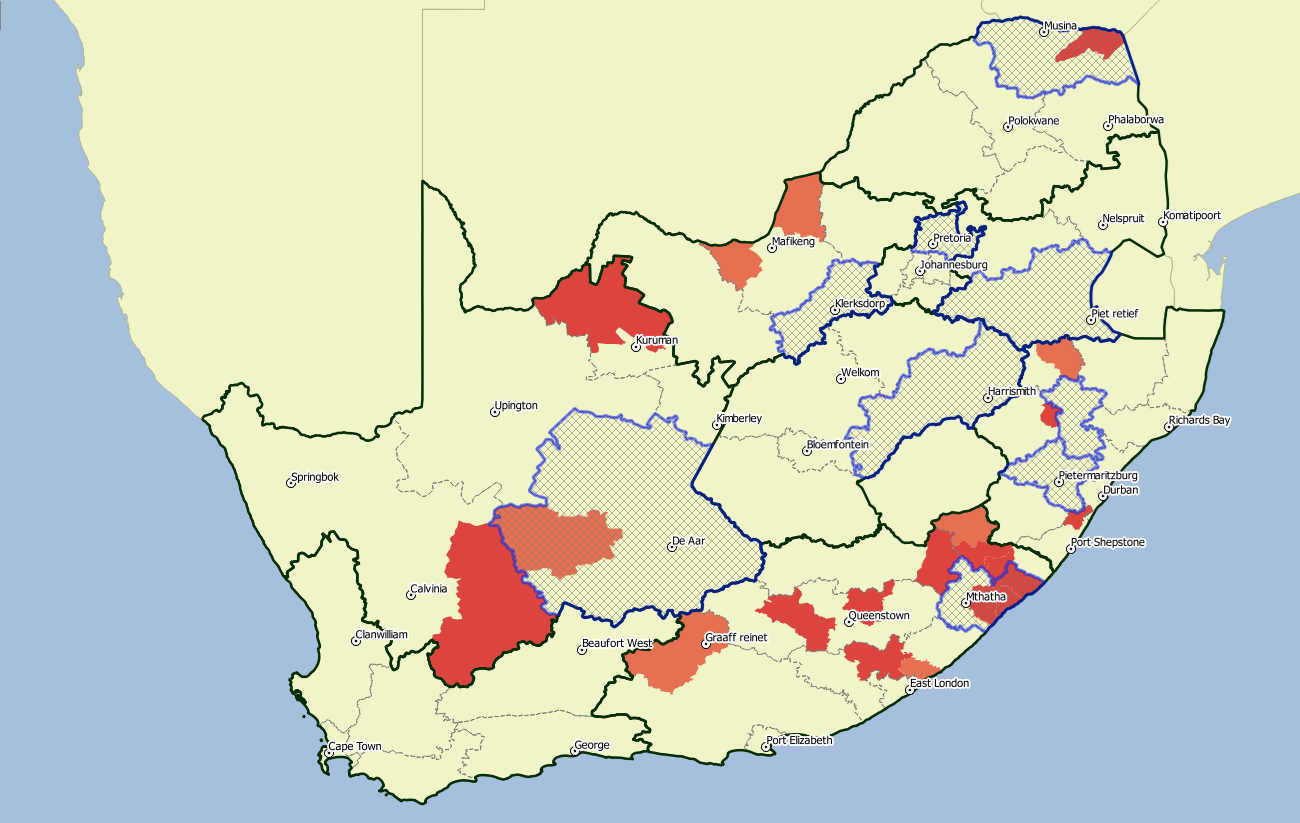
From the above, the most deprived areas for internet services are in the Chris Hani, Alfred Nzo and OR Tambo districts — all in the Eastern Cape. KwaZulu-Natal is marginally better off.
The best and the worst
Considering the other end of the scale, Figure 4 shows that the areas with the best internet access are including some — but not all —of the main metropolitan areas plus some largely rural areas. Indeed the City of Tshwane ranks highest but there are other areas which are surprising. For example, the Siyathemba municipality in the Northern Cape — the home of Prieska — fares very well with nearly one-third of households saying that they can access the internet at a library, community hall, Thusong or similar centre. Over quarter of the Richtersveld households are recorded as having internet access in the dwelling. The Western Cape area of Drakenstein ranks higher than the City of Johannesburg, and its neighbouring areas of Baviaans and George also fare well. Here high levels of access in the dwelling bias the result. The reason for these anomalies may well lie in the spatial distribution of households in these areas — those more concentrated in villages and towns (as in the Northern Cape) have quite different access to those in areas where houses are more uniformly spread over wide areas, such as in the Eastern Cape.
Figure 4 - 20 lowest (best) deprivation ranking municipalities on the BMI-T ISDI 2016
Conclusion
The health check that comes from the above is that use of survey results may produce ‘interesting’ results but the use and weighting of factors needs to be carefully considered. This is true in the case of internet access and ICT too, and the above demonstrates that simple approaches cannot — and should not — be used to determine which areas are ‘underserviced’. Given the wide variation in our societies, the granularity of a municipality — particularly a district municipality — can be too large to produce valuable results.
Notes on the Community Survey 2016
Stats SA visited approximately 1.3 million sampled households across the country. The CS 2016 is the second large sample survey Statistics South Africa undertook after CS 2007, but this time around the data are collected electronically using Computer Assisted Personal Interviewing (CAPI) system as opposed to the paper collection method used in CS 2007.
The sample design for CS 2016 was a stratified single stage sample design. At EA level, all inscope EAs were included in the sample and a sample of dwelling units was taken within each EA (i.e. there was no sub-sampling of EAs). The EA frame was based on the Census 2011 information. The updated dwelling unit (DU) frame was constructed by the Geography team using geo-referenced spatial systems.
References
[1] http://www.polity.org.za/article/irr-launches-a-new-local-government-index-ahead-of-polls-2016-06-07
[2] BD Live, Deprivation index shows Alfred Nzo municipality is the worst in SA, 7 June 2016
[Text] - StatsSA - http://www.statssa.gov.za/?page_id=6283)


